API Stats
On the details page of an API project, click on the Stats tab to see the stats of your requests by the following metrics:
- Today Metrics
- Request Cost
- Response Time
- Response Result
- Methods
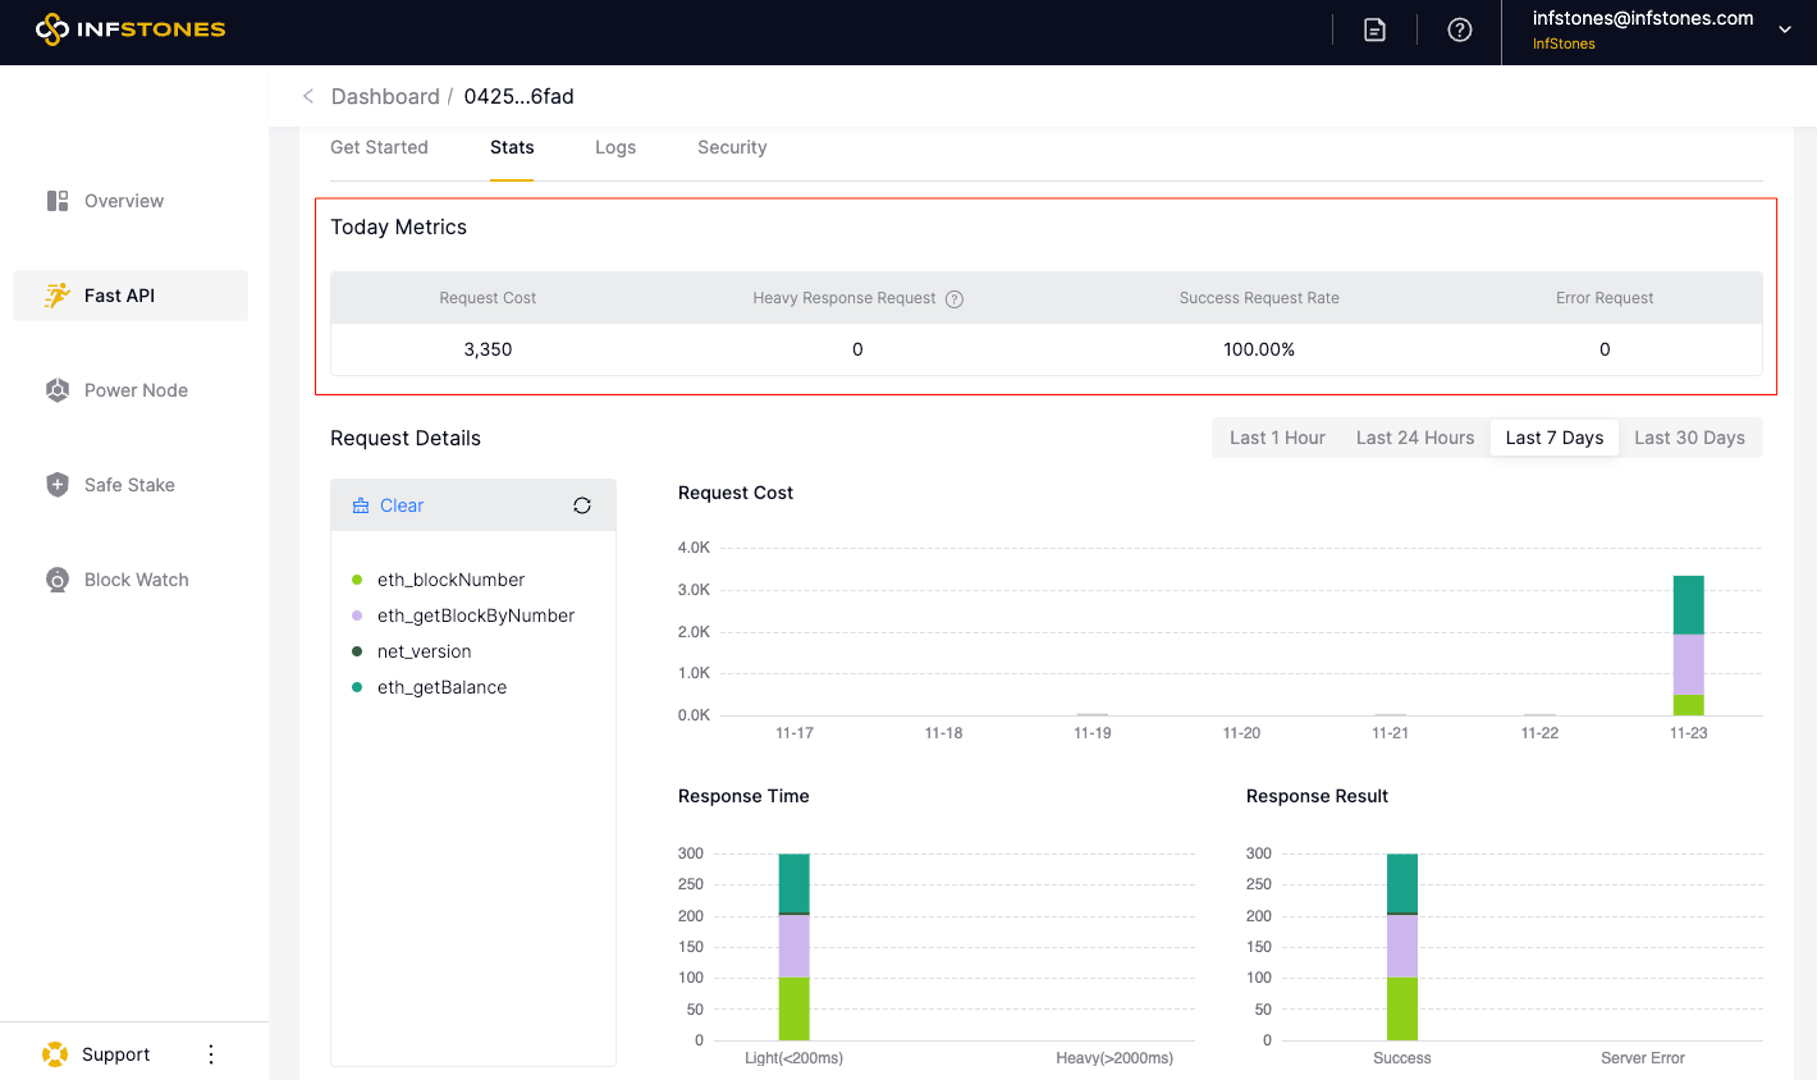
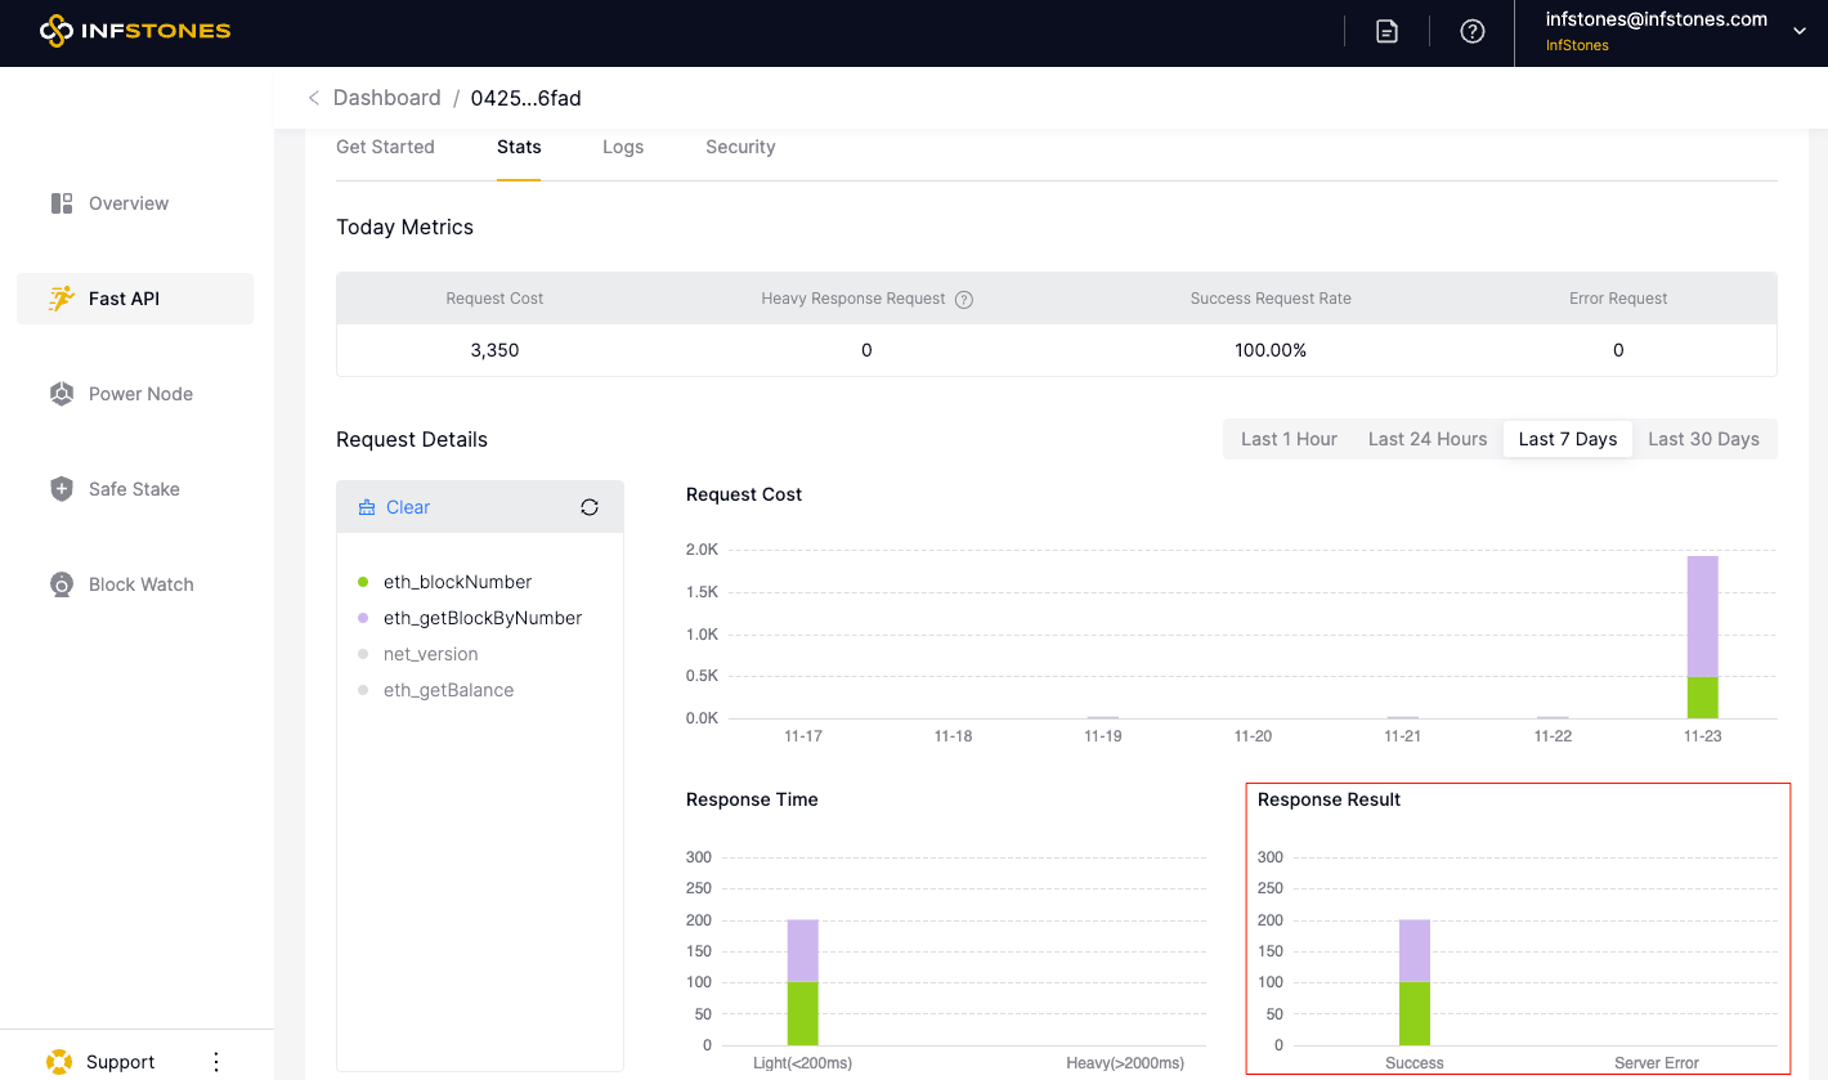
1 Today Metrics Stats
You can view Today Metrics stats as shown in the following table. Today Metrics includes 4 aspects:
- Request Cost: total request cost consumed today.
- Heavy Response Request: the number of requests whose response time exceeds 2000ms.
- Success Request Rate: the proportion of successful requests out of the total requests.
- Error Request: the number of failed requests.
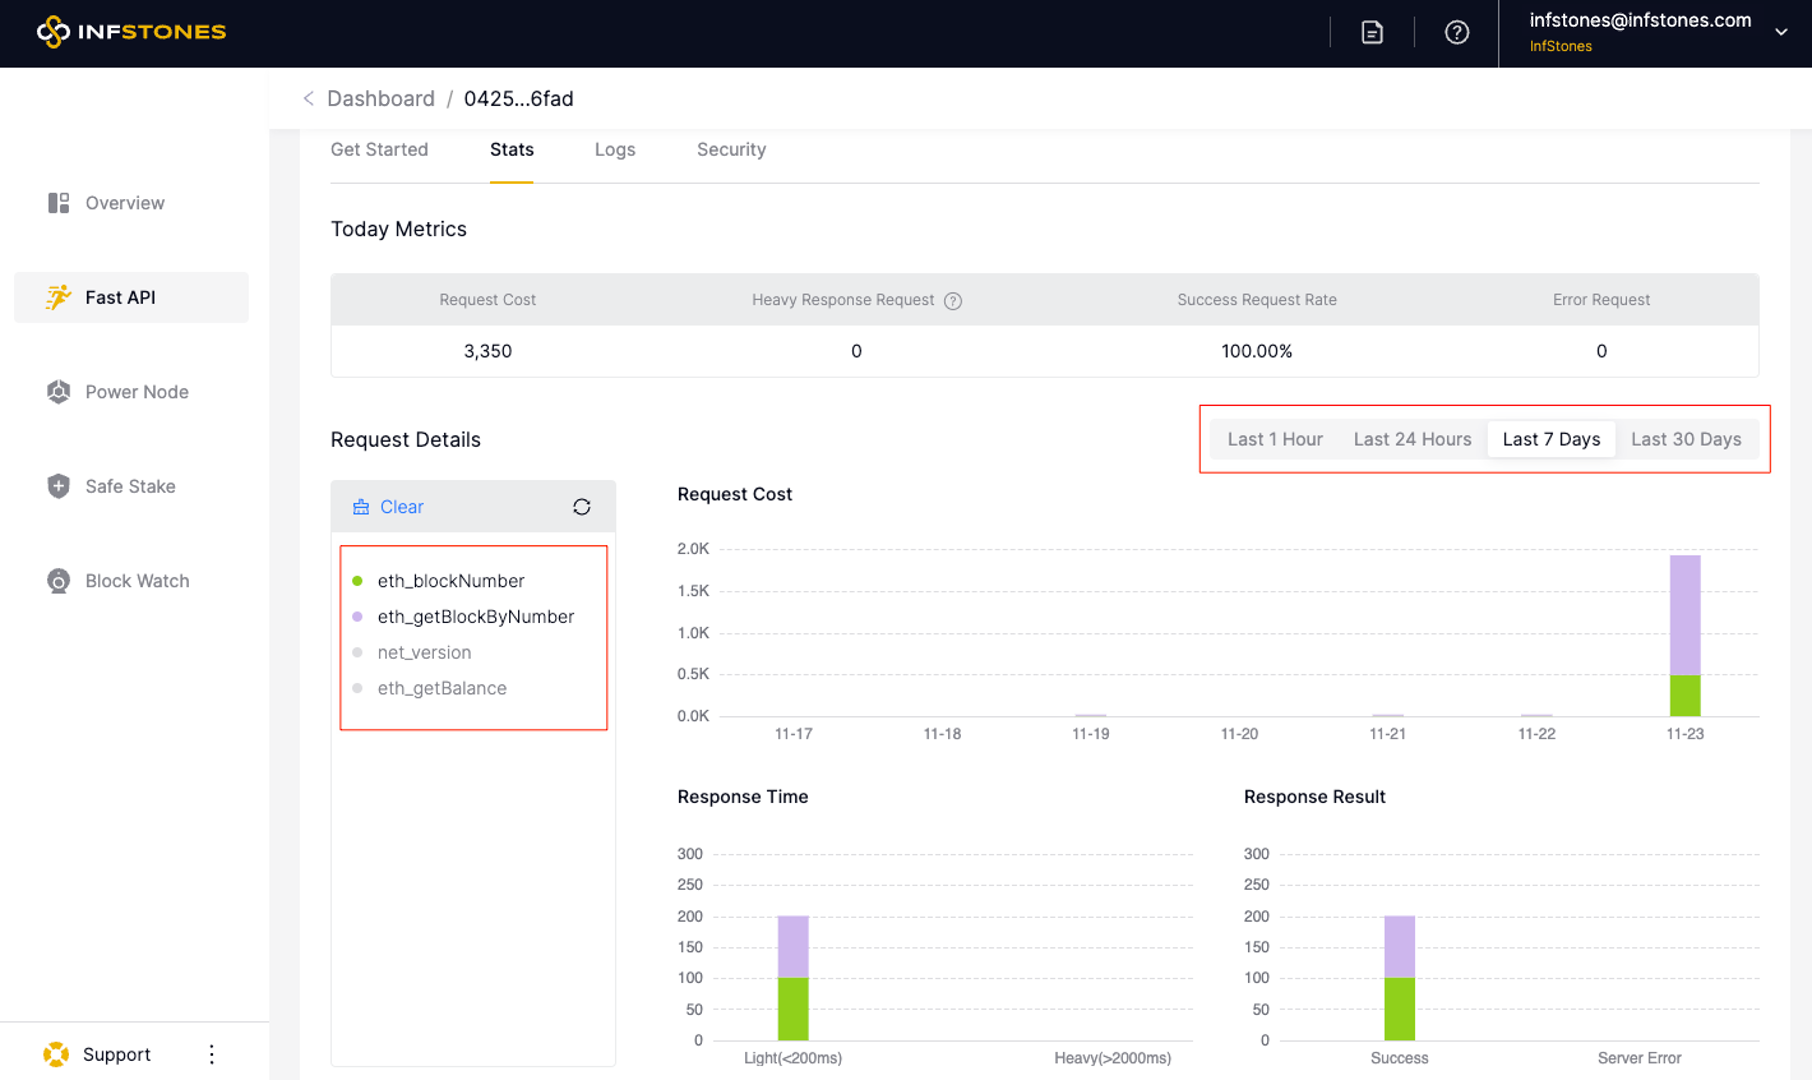
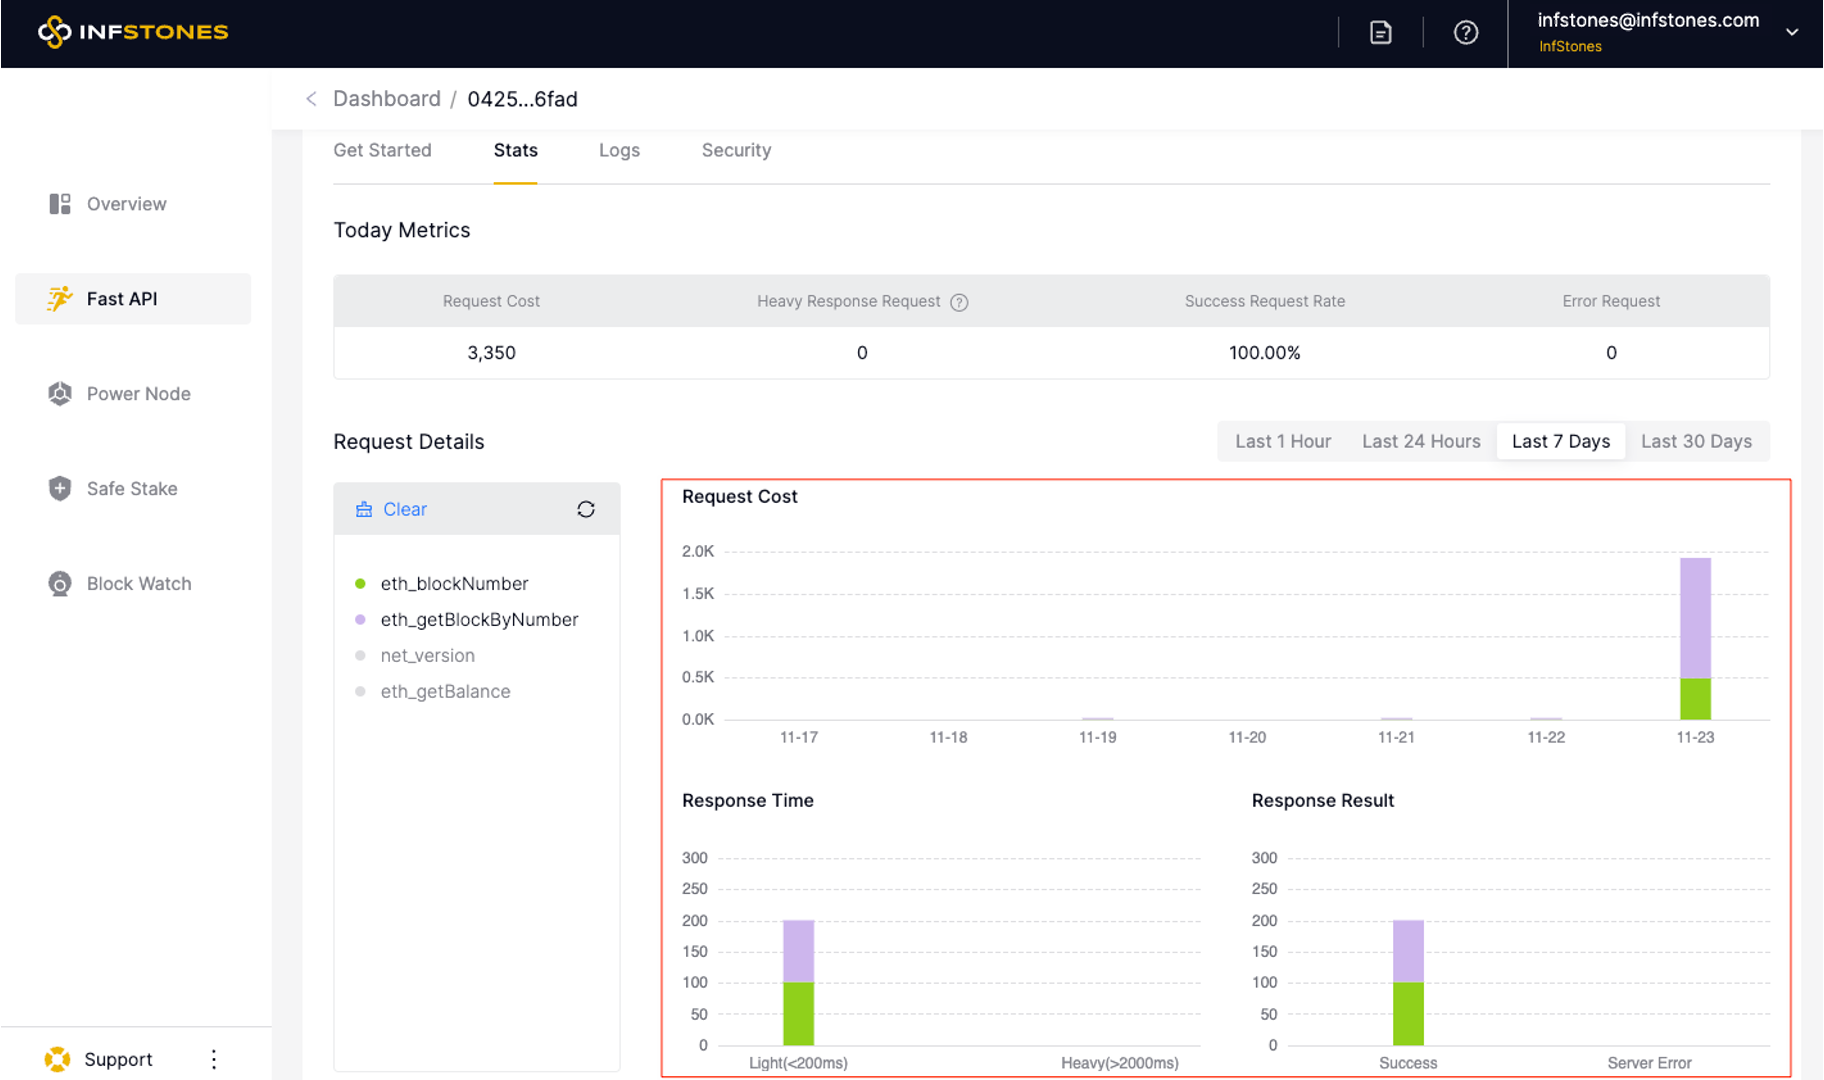
2 Request Cost Stats
You can see the cost of different requests in different time ranges by clicking on the corresponding option. For example, you can click on eth_blockNumber,eth_getBlockByNumber and Last 7 Days to check the cost of eth_blockNumber and eth_getBlockByNumber requests in Last 7 Days.
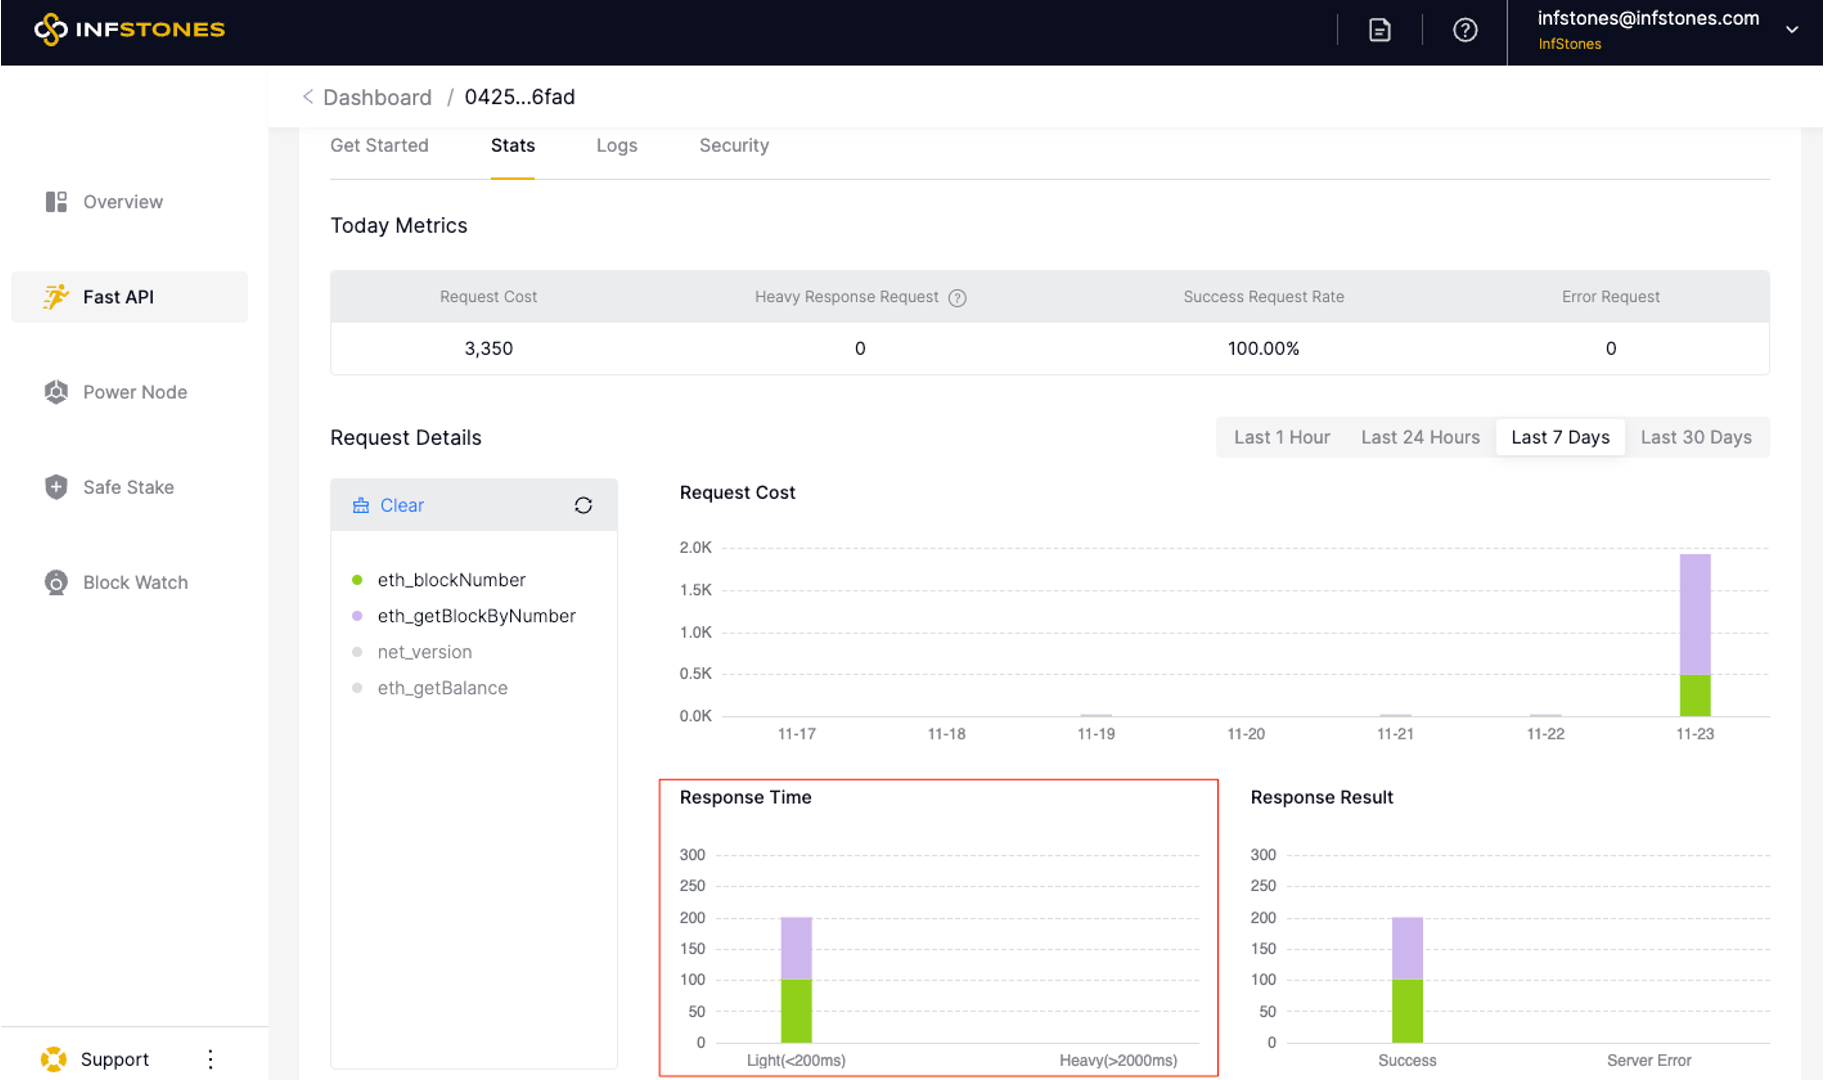
3 Response Time Stats
You can view the response time stats as shown in the following chart. Response time includes the following 3 types:
- Light: the response time of corresponding request is less than 200ms.
- Medium: the response time of corresponding request is between 200 to 2000ms.
- Heavy: the response time of corresponding request is more than 2000ms.
4 Response Result Stats
You can view the response result stats as shown in the following chart. Response result includes the following 4 types:
- Success: the response is successfully returned.
- Client Error: the service provided has encountered a failure.
- Server Error: some requests may encounter issues, such as parameter errors or other issues.
- Rate Limit: request rate exceeds the maximum allowed rate limit of the current service plan.
5 Methods Stats
You can view all of the methods used, as well as their API usage and request cost.